2.3 IGV for BAM Visualising
The Integrative Genomics Viewer (IGV) is a powerful tool for visualising BAM files and inspecting read alignments, coverage, and features in a genomic context.
IGV is particularly useful for exploring variants in the data, as it allows you to visualise the read pileup, identify mismatches, insertions, deletions, and other features that may indicate the presence of variants.
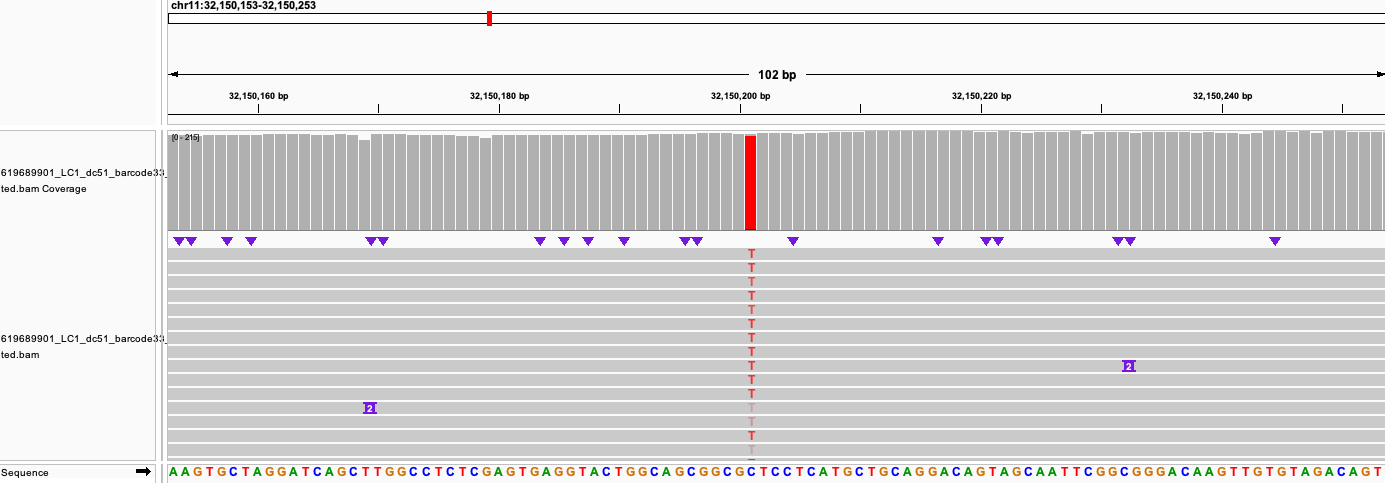
This is a snapshot of long read ONT data visualised in IGV. The red bars indicate mismatches between the reads and the reference genome, which may represent potential variants. The coverage track at the bottom shows the depth of sequencing coverage across the region. In this case there is a clear variant from the reference genome (C>T), which is supported by multiple reads, indicating that it is likely a true variant rather than a sequencing error.
Installing IGV
- Download IGV from Broad Institute IGV Downloads
- Follow the installation instructions for your operating system (Windows, macOS, Linux)
Loading a BAM File
From your local machine:
- Open IGV and select the appropriate genome build (e.g., mm10, hg38).
- Go to File > Load from File… and select your BAM file (make sure the index
.baifile, is in the same folder as the local download). - The aligned reads will appear as tracks in the IGV browser.
From a URL:
- Go to File > Load from URL… and enter the URL of your BAM file (ensure the BAM file is publicly accessible and has an index file).
- Paste the URL of the .bai index file as well.
- The aligned reads will appear as tracks in the IGV browser.
To a custom reference genome:
- Go to Genomes > Load Genome from File… and select your reference genome FASTA file. (Make sure the FASTA file is indexed with a
.faifile in the same folder.) - Make sure your bams are aligned to the same reference genome you have loaded in IGV for accurate visualization of mismatches and variants.
- Load your BAM file as described above.
Exploring BAM Data in IGV
- Zoom and Pan: Use the navigation bar or mouse to zoom in/out and move along the genome.
- Read Alignments: Each read is shown as a horizontal bar. Mismatches, insertions, and deletions are highlighted.
- Mismatches are shown as colored bases.
- Insertions are shown as a small vertical line.
- Deletions are shown as a gap in the read alignment.
- Coverage Track: Shows the depth of sequencing coverage at each position.
- View Splice Junctions: For RNA-seq, IGV can display splice junction arcs.
Example
To view a region:
- Type
chr11:32224569-32251632in the “Go to” box and press Enter. - Inspect the read pileup, coverage, and any features of interest.
For more details, see the IGV User Guide.