library(tidyverse)
library(DESeq2)
library(cowplot)
library(zoo)
library(dplyr)Capture-C Analysis Example Notebook
This notebook analyses CaptureC counts from concatenated .gff files for a single viewpoint. It produces:
- Cis-normalised interaction profiles
- Smoothed plots with difference (subtraction) tracks
- Gene annotation tracks using plotgardener
- Significant contact changes between conditions using DESeq2
After running the CaptureC pipeline, each sample will have a concatenated .gff file per viewpoint with the following structure:
| Chr | Analyser | Capture | Fragment start | Fragment End | Count | Strand | 0 | . |
|---|---|---|---|---|---|---|---|---|
| chr11 | CC3 | Hba-1 | 32179084 | 32179641 | 60 | + | 0 | . |
| chr11 | CC3 | Hba-1 | 32179642 | 32179816 | 39 | + | 0 | . |
You can also download the .Rmd to run in RStudio on your own data: CaptureC Analysis Notebook
Loading the packages
Define your gff inputs here
You can run this from concatenated .gffs per sample which have the column structure:
| chr  | source | viewpoint | reporter start | reporter end | count | strand | frame | attribute |
|------|--------|-----------|----------------|--------------|-------|--------|-------|-----------|
| chr1 | CC3    | Hba-1     | 10002466       | 10003091     | 1     | +      | 0     | .         |
files <- c(
"Dt1t2_ter119_exp2_rep1_mm9_dpnii_concatenated.gff",
"Dt1t2_ter119_exp2_rep2_mm9_dpnii_concatenated.gff",
"Dt1t2_ter119_exp2_rep3_mm9_dpnii_concatenated.gff",
"WT_ter119_exp2_rep1_mm9_dpnii_concatenated.gff",
"WT_ter119_exp2_rep2_mm9_dpnii_concatenated.gff",
"WT_ter119_exp2_rep3_mm9_dpnii_concatenated.gff"
)
# Remove the repetitive parts of the names
# Change this according to your sample names
names <- basename(files)
names <- gsub("_ter119_exp2", "", names)
names <- gsub("_mm9_dpnii_concatenated\\.gff", "", names)
# Build a sample|condition table
sample_sheet <- data.frame(
gff_file = files,
filename = basename(files),
sample = names,
condition = gsub("_rep\\d+$", "", names),
replicate = gsub(".*_(rep\\d+)$", "\\1", names))
sample_sheet gff_file
1 Dt1t2_ter119_exp2_rep1_mm9_dpnii_concatenated.gff
2 Dt1t2_ter119_exp2_rep2_mm9_dpnii_concatenated.gff
3 Dt1t2_ter119_exp2_rep3_mm9_dpnii_concatenated.gff
4 WT_ter119_exp2_rep1_mm9_dpnii_concatenated.gff
5 WT_ter119_exp2_rep2_mm9_dpnii_concatenated.gff
6 WT_ter119_exp2_rep3_mm9_dpnii_concatenated.gff
filename sample condition
1 Dt1t2_ter119_exp2_rep1_mm9_dpnii_concatenated.gff Dt1t2_rep1 Dt1t2
2 Dt1t2_ter119_exp2_rep2_mm9_dpnii_concatenated.gff Dt1t2_rep2 Dt1t2
3 Dt1t2_ter119_exp2_rep3_mm9_dpnii_concatenated.gff Dt1t2_rep3 Dt1t2
4 WT_ter119_exp2_rep1_mm9_dpnii_concatenated.gff WT_rep1 WT
5 WT_ter119_exp2_rep2_mm9_dpnii_concatenated.gff WT_rep2 WT
6 WT_ter119_exp2_rep3_mm9_dpnii_concatenated.gff WT_rep3 WT
replicate
1 rep1
2 rep2
3 rep3
4 rep1
5 rep2
6 rep3# Define the control condition
ref_condition = "WT"
cond_levels <- unique(sample_sheet$condition)
# Reference first
cond_levels <- c(ref_condition, setdiff(cond_levels, ref_condition))
cond_string <- paste(cond_levels, collapse = "_vs_")
# Assign colours for the conditions
palette <- c("WT"="#262626",
"Dt1t2"="#1D91C0")Define other inputs
# Choose your viewpoint to plot here
plot_viewpoint = "Hba-1"

# Path to the viewpoint coordinate file here
oligo_file = "Oligofile.txt"


# This loads it in
all_viewpoint = read_tsv(oligo_file, col_names = c("Viewpoint", "chr", "start", "end"))

viewpoint_coord = all_viewpoint[ all_viewpoint$Viewpoint == plot_viewpoint ,]

viewpoint_coord
# A tibble: 1 × 6
Viewpoint chr start end X5 X6
<chr> <dbl> <dbl> <dbl> <dbl> <chr>
1 Hba-1 11 32182969 32183821 1 A Define your plotting parameters
# Chromosome is imported from the viewpoint file
chr_use = paste0("chr",viewpoint_coord$chr)

# Define the start and end coordinates of the whole plot
plot_start = 32020000
plot_end = 32300000

# Padding for the viewpoint exclusion
excl_pad = 3000
excl_start = viewpoint_coord$start - excl_pad
excl_end = viewpoint_coord$end + excl_pad

# Padding for the viewpoint exclusion
bin_size = 500
window_size_smooth = 2500

padj_thresh = 0.01
——— No editing is needed from here —————-
Loading the gff files
load_gff <- function(file, sample_name) {
  read_tsv(file, col_names = FALSE, comment = "#", show_col_types = FALSE) %>%
    transmute(
      capture = X3,
      chr = X1,
      start = as.numeric(X4),
      end = as.numeric(X5),
      count = as.numeric(X6),
      sample = sample_name,
      condition = strsplit(sample_name, "_")[[1]][1],
      midpoint = floor((start + end) / 2)
    )
}

all_df <- map2_df(sample_sheet$gff_file, sample_sheet$sample, load_gff) %>%
  filter(chr == chr_use) %>%
  filter(end < excl_start | start > excl_end)

if (nrow(all_df) == 0)
  stop("No fragments on ", chr_use, " — check chromosome naming in GFF files")

all_df
# A tibble: 65,065 × 8
capture chr start end count sample condition midpoint
<chr> <chr> <dbl> <dbl> <dbl> <chr> <chr> <dbl>
1 Hba-1 chr11 100142861 100143052 1 Dt1t2_rep1 Dt1t2 100142956
2 Hba-1 chr11 100232583 100232994 1 Dt1t2_rep1 Dt1t2 100232788
3 Hba-1 chr11 100392152 100392520 1 Dt1t2_rep1 Dt1t2 100392336
4 Hba-1 chr11 100455808 100456194 1 Dt1t2_rep1 Dt1t2 100456001
5 Hba-1 chr11 100537344 100537510 1 Dt1t2_rep1 Dt1t2 100537427
6 Hba-1 chr11 100575601 100576546 1 Dt1t2_rep1 Dt1t2 100576073
7 Hba-1 chr11 100611032 100611146 1 Dt1t2_rep1 Dt1t2 100611089
8 Hba-1 chr11 100621841 100622623 3 Dt1t2_rep1 Dt1t2 100622232
9 Hba-1 chr11 100666329 100667401 1 Dt1t2_rep1 Dt1t2 100666865
10 Hba-1 chr11 100669576 100669689 1 Dt1t2_rep1 Dt1t2 100669632
# ℹ 65,055 more rowsall_df %>%
group_by(sample, capture) %>%
summarise(n_fragments = n())# A tibble: 30 × 3
# Groups: sample [6]
sample capture n_fragments
<chr> <chr> <int>
1 Dt1t2_rep1 Hba-1 6636
2 Dt1t2_rep1 Hba-2 6659
3 Dt1t2_rep1 Hbb-b1 385
4 Dt1t2_rep1 Hbb-b2 405
5 Dt1t2_rep1 Slc25A37 882
6 Dt1t2_rep2 Hba-1 3188
7 Dt1t2_rep2 Hba-2 3161
8 Dt1t2_rep2 Hbb-b1 181
9 Dt1t2_rep2 Hbb-b2 202
10 Dt1t2_rep2 Slc25A37 534
# ℹ 20 more rowsFilter for the viewpoint of interest
df = all_df[ all_df$capture == plot_viewpoint,]
df
# A tibble: 29,058 × 8
capture chr start end count sample condition midpoint
<chr> <chr> <dbl> <dbl> <dbl> <chr> <chr> <dbl>
1 Hba-1 chr11 100142861 100143052 1 Dt1t2_rep1 Dt1t2 100142956
2 Hba-1 chr11 100232583 100232994 1 Dt1t2_rep1 Dt1t2 100232788
3 Hba-1 chr11 100392152 100392520 1 Dt1t2_rep1 Dt1t2 100392336
4 Hba-1 chr11 100455808 100456194 1 Dt1t2_rep1 Dt1t2 100456001
5 Hba-1 chr11 100537344 100537510 1 Dt1t2_rep1 Dt1t2 100537427
6 Hba-1 chr11 100575601 100576546 1 Dt1t2_rep1 Dt1t2 100576073
7 Hba-1 chr11 100611032 100611146 1 Dt1t2_rep1 Dt1t2 100611089
8 Hba-1 chr11 100621841 100622623 3 Dt1t2_rep1 Dt1t2 100622232
9 Hba-1 chr11 100666329 100667401 1 Dt1t2_rep1 Dt1t2 100666865
10 Hba-1 chr11 100669576 100669689 1 Dt1t2_rep1 Dt1t2 100669632
# ℹ 29,048 more rowsdf %>%
group_by(sample, capture) %>%
summarise(n_fragments = n())# A tibble: 6 × 3
# Groups: sample [6]
sample capture n_fragments
<chr> <chr> <int>
1 Dt1t2_rep1 Hba-1 6636
2 Dt1t2_rep2 Hba-1 3188
3 Dt1t2_rep3 Hba-1 2932
4 WT_rep1 Hba-1 4281
5 WT_rep2 Hba-1 8520
6 WT_rep3 Hba-1 3501Cis-Normalisation
Counts normalised to interactions per 100,000, cis-only, excluding the probe region.
norm_df <- df %>%
  group_by(sample) %>%
  mutate(norm_factor = sum(count)/100000,
         norm_count = count / norm_factor) %>%
  ungroup()
Difference tracks
Mean normalised count per condition with reference subtracted. Positive = more contacts; negative = fewer contacts than reference.
subtractions <- norm_df %>%
  group_by(chr, start, end, condition) %>%
  summarise(mean = mean(norm_count), .groups = "drop") %>%
  pivot_wider(names_from = condition, values_from = mean, values_fill = 0) %>%

  mutate(across(all_of(setdiff(cond_levels, ref_condition)),
                ~ .x - .data[[ref_condition]],
                .names = "{.col}_minus_{ref_condition}")) %>%

  filter(start >= plot_start, end <= plot_end)

subtractions
# A tibble: 602 × 6
chr start end WT Dt1t2 Dt1t2_minus_WT
<chr> <dbl> <dbl> <dbl> <dbl> <dbl>
1 chr11 32020271 32021268 10.4 7.11 -3.27
2 chr11 32021294 32023427 15.6 17.9 2.29
3 chr11 32023428 32024368 7.08 6.26 -0.822
4 chr11 32024369 32026059 6.39 8.95 2.57
5 chr11 32026060 32026215 0 7.11 7.11
6 chr11 32026216 32026512 7.81 8.43 0.620
7 chr11 32026513 32026549 18.0 0 -18.0
8 chr11 32026550 32026817 3.54 0 -3.54
9 chr11 32026818 32027130 7.08 3.56 -3.52
10 chr11 32027131 32027802 9.01 12.9 3.90
# ℹ 592 more rowsBin and smooth
500 bp bins, 2500 bp sliding window. Each replicate smoothed individually before averaging across replicates.
# Bins
bins <- tibble(
  bin_start = seq(plot_start, plot_end - bin_size, by = bin_size)) %>%
  mutate(bin_end = bin_start + bin_size - 1, bin_id = row_number())

windowbins <- floor(((window_size_smooth / bin_size) - 1) / 2)
bins_contributing <- 2 * windowbins + 1

# Bin, smooth per replicate, then summarise per condition
summary_df <- norm_df %>%
  cross_join(bins) %>%
  filter(end > bin_start, start < bin_end) %>%
  mutate(overlap_bp = pmax(0, pmin(end, bin_end) - pmax(start, bin_start)),
         weighted_count = norm_count * (overlap_bp / bin_size)) %>%

  group_by(chr, bin_id, bin_start, bin_end, sample, condition) %>%
  summarise(binned_count = sum(weighted_count), .groups = "drop") %>%
  arrange(condition, sample, bin_start) %>%
  group_by(condition, sample) %>%
  mutate(smoothed_count = rollmean(binned_count, k = bins_contributing,
                              align = "center", fill = "extend"),
          pos = bin_start + (bin_end - bin_start) / 2) %>%
  ungroup() %>%
  group_by(pos, condition) %>%
  summarise(mean_count = mean(smoothed_count),
            sd_count = sd(smoothed_count),
.groups = "drop")summary_df# A tibble: 1,076 × 4
pos condition mean_count sd_count
<dbl> <chr> <dbl> <dbl>
1 32020250. Dt1t2 4.41 NA
2 32020250. WT 9.95 2.93
3 32020750. Dt1t2 4.41 NA
4 32020750. WT 8.31 0.961
5 32021250. Dt1t2 9.96 7.84
6 32021250. WT 9.95 2.93
7 32021750. Dt1t2 15.5 NA
8 32021750. WT 12.1 1.57
9 32022250. Dt1t2 15.5 NA
10 32022250. WT 13.7 2.39
# ℹ 1,066 more rowsBuild exclusion zones for plotting
all_viewpoint# A tibble: 5 × 6
Viewpoint chr start end X5 X6
<chr> <dbl> <dbl> <dbl> <dbl> <chr>
1 Hba-1 11 32182969 32183821 1 A
2 Hba-2 11 32195804 32196638 1 A
3 Hbb-b1 7 110961967 110962817 1 A
4 Hbb-b2 7 110975976 110976456 1 A
5 Slc25A37 14 69902454 69903469 1 A viewpoint_start = viewpoint_coord$start
viewpoint_end = viewpoint_coord$end
# Globin duplicate: separate exclusion zone for the partner probe
partner_excl <- NULL
globin_pairs <- list(
c("Hba-1", "Hba-2"),
c("Hba-a1", "Hba-a2"),
c("Hbb-b1", "Hbb-b2"))
partner_vp <- NULL
for (pair in globin_pairs) {
if (plot_viewpoint %in% pair) {
partner_vp <- setdiff(pair, plot_viewpoint)
break
}
}
if (!is.null(partner_vp) && length(partner_vp) == 1) {
partner_coord <- all_viewpoint[all_viewpoint$Viewpoint == partner_vp, ]
if (nrow(partner_coord) == 0) {
message("Partner viewpoint '", partner_vp,
"' not found in oligo file — skipping partner exclusion zone")
partner_excl <- NULL
} else {
partner_excl <- list(
start = partner_coord$start[1] - excl_pad,
end = partner_coord$end[1] + excl_pad,
probe_start = partner_coord$start[1],
probe_end = partner_coord$end[1]
)
message("Globin duplicate: adding exclusion zone for ", partner_vp)
}
} else {
partner_excl <- NULL
}add_annotations <- function(p) {
p <- p +
# Primary viewpoint exclusion zone
geom_rect(aes(xmin = excl_start, xmax = excl_end, ymin = -Inf, ymax = Inf),
inherit.aes = FALSE, fill = "white", color = "black") +
# Primary viewpoint probe
geom_rect(aes(xmin = viewpoint_start, xmax = viewpoint_end, ymin = -Inf, ymax = Inf),
inherit.aes = FALSE, fill = "black")
# Partner probe exclusion zone (globin duplicates only)
if (!is.null(partner_excl)) {
p <- p +
geom_rect(aes(xmin = partner_excl$start, xmax = partner_excl$end, ymin = -Inf, ymax = Inf),
inherit.aes = FALSE, fill = "white", color = "black") +
geom_rect(aes(xmin = partner_excl$probe_start, xmax = partner_excl$probe_end, ymin = -Inf, ymax = Inf),
inherit.aes = FALSE, fill = "black")
}
p
}Main plot
p1 <- ggplot(summary_df, aes(x = pos, y = mean_count, color = condition, fill = condition)) +
  geom_ribbon(aes(ymin = mean_count - sd_count,
                  ymax = mean_count + sd_count),
              alpha = 0.15, color = NA) +
  geom_line(linewidth = 0.6, alpha = 0.9) +
  scale_color_manual(values = palette) +
  scale_fill_manual(values = palette) +
  scale_x_continuous(limits = c(plot_start, plot_end), expand = c(0, 0)) +
  scale_y_continuous(expand = c(0, 0)) +
  labs(y = "Mean interactions per fragment",
       x = paste0(chr_use, " position (bp)"),
       color = NULL, fill = NULL,
       title = paste0(plot_viewpoint, "  |  ", chr_use, ":",
                      format(plot_start, big.mark = ","), " – ",
                      format(plot_end, big.mark = ","))) +
  theme_bw() +
  theme(panel.grid = element_blank(),
        legend.position = c(0.98, 0.5),
        legend.justification = c("right", "center"),
        legend.direction = "vertical",
        text = element_text(size = 12))

p1 <- add_annotations(p1)
p1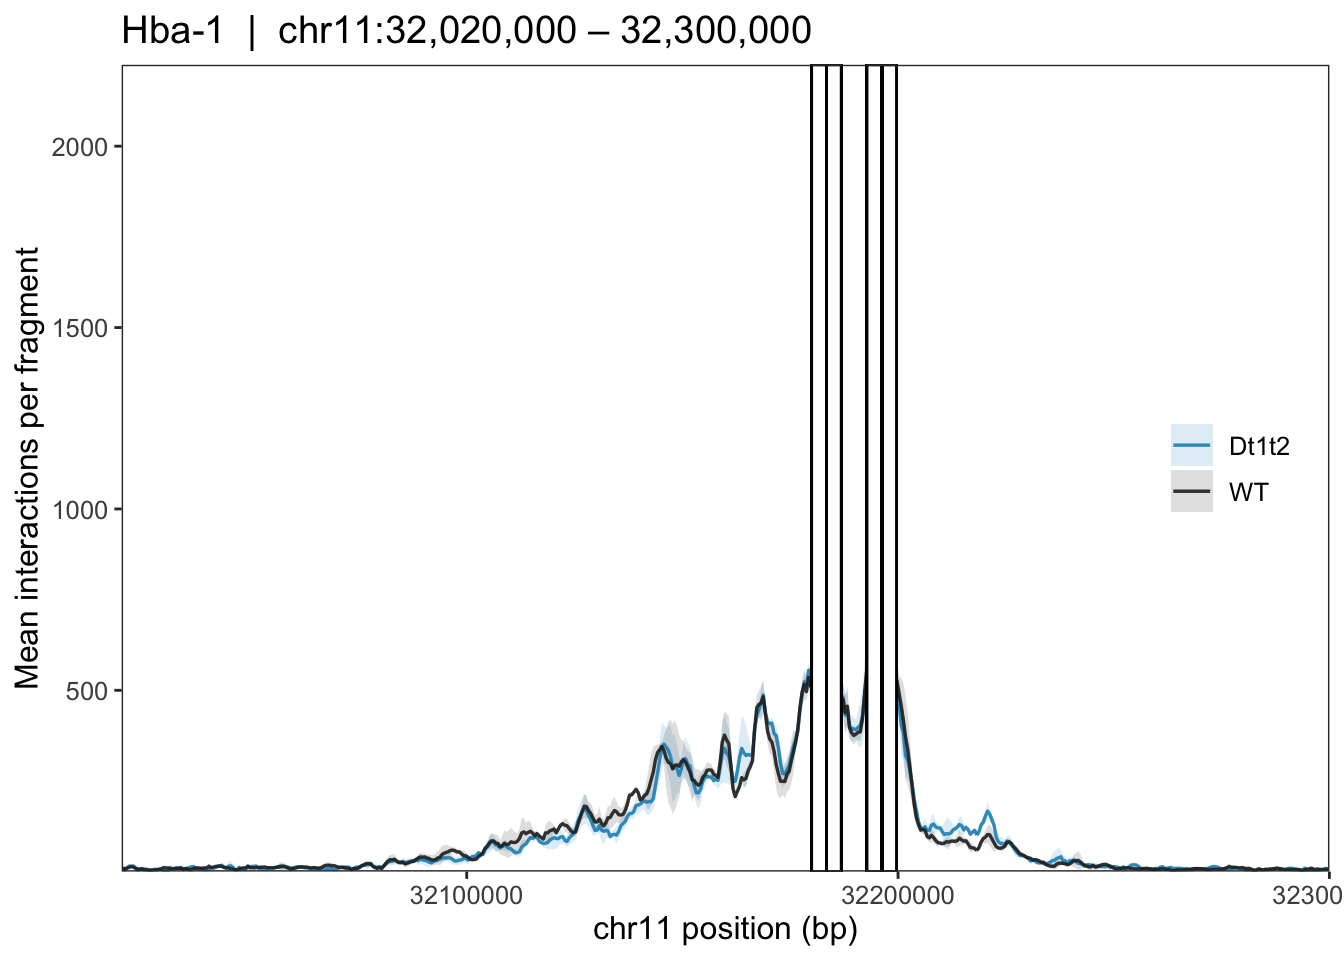
Subtraction plots
delta_plot_list <- map(setdiff(cond_levels, ref_condition), function(cond) {
  delta_col <- paste0(cond, "_minus_", ref_condition)
  y_lim <- max(abs(range(subtractions[[delta_col]], na.rm = TRUE))) * 1.1

  p <- ggplot(subtractions) +
    geom_rect(aes(xmin = start, xmax = end, ymin = 0, ymax = .data[[delta_col]]),
              fill = palette[[cond]], alpha = 0.75) +
    geom_hline(yintercept = 0, linewidth = 0.3, color = "grey40") +
    scale_x_continuous(limits = c(plot_start, plot_end), expand = c(0, 0)) +
    scale_y_continuous(limits = c(-y_lim, y_lim), expand = c(0, 0),
                       breaks = pretty(c(-y_lim, y_lim), n = 3)) +
    labs(y = bquote(Delta ~ .(cond) - .(ref_condition)),
         x = paste0(chr_use, " position (bp)")) +
    theme_bw() +
    theme(panel.grid = element_blank(),
          text = element_text(size = 12))

  add_annotations(p)
})
Combined plots
# Remove x axis from main plot
p1 <- p1 + theme(axis.title.x = element_blank(),
                 axis.text.x = element_blank(),
                 axis.ticks.x = element_blank())

# Remove x axis from all delta plots except the last
n <- length(delta_plot_list)
delta_plot_list[-n] <- map(delta_plot_list[-n], ~ .x +
    theme(axis.title.x = element_blank(),
          axis.text.x = element_blank(),
          axis.ticks.x = element_blank()))
all_plots <- c(list(p1), delta_plot_list)
rel_heights <- c(2.5, rep(1, length(delta_plot_list)))
final_plot <- plot_grid(plotlist = all_plots, ncol = 1,
align = "v", axis = "l", rel_heights = rel_heights)
final_plot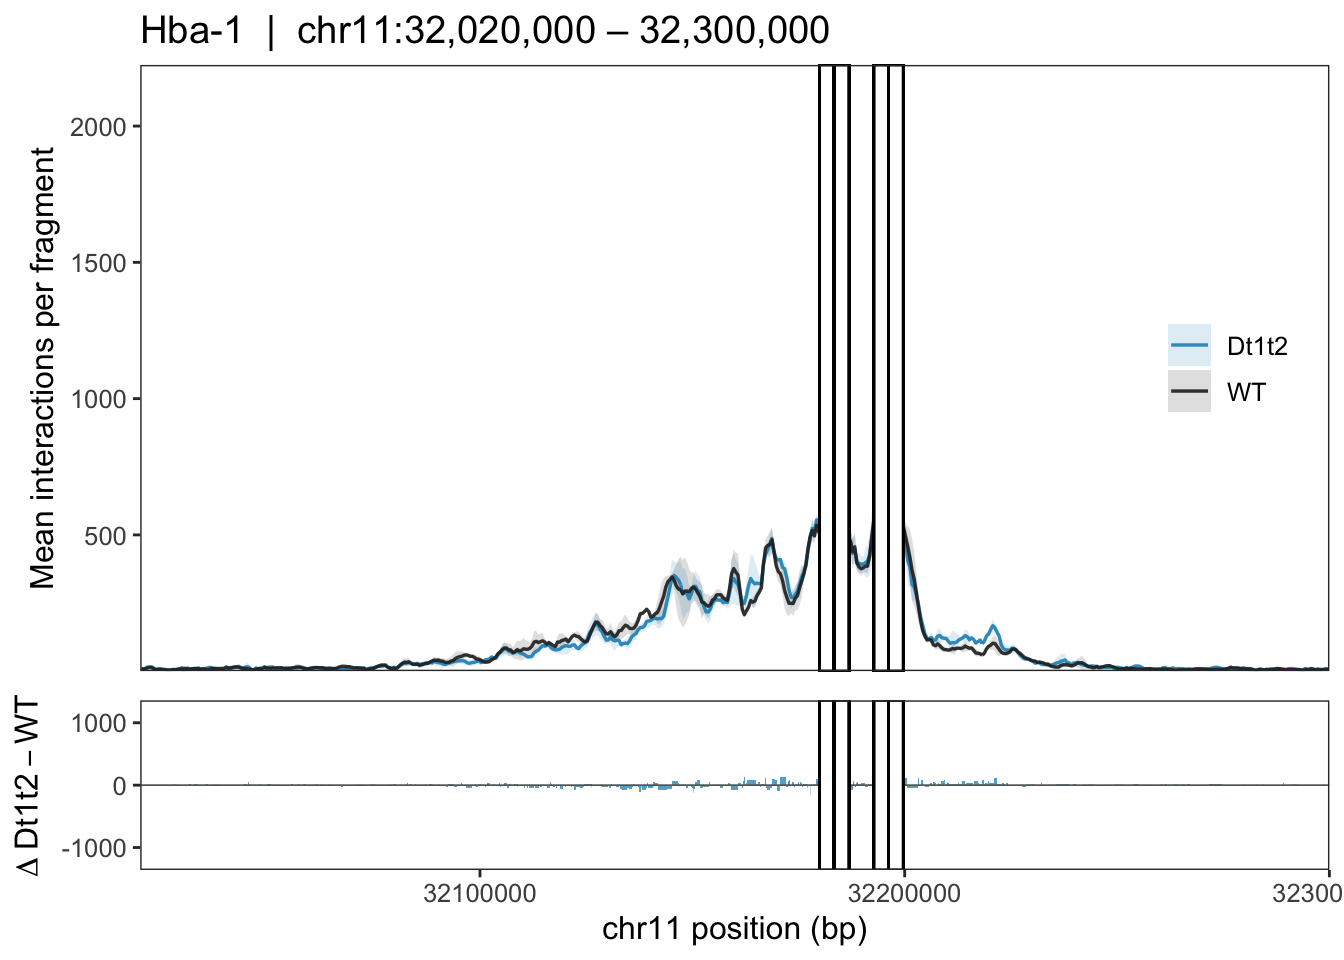
# ggsave(plot_file, plot = final_plot, width = 10, height = 4 + 2 * length(delta_plot_list), units = "in")Combining with gene annotations
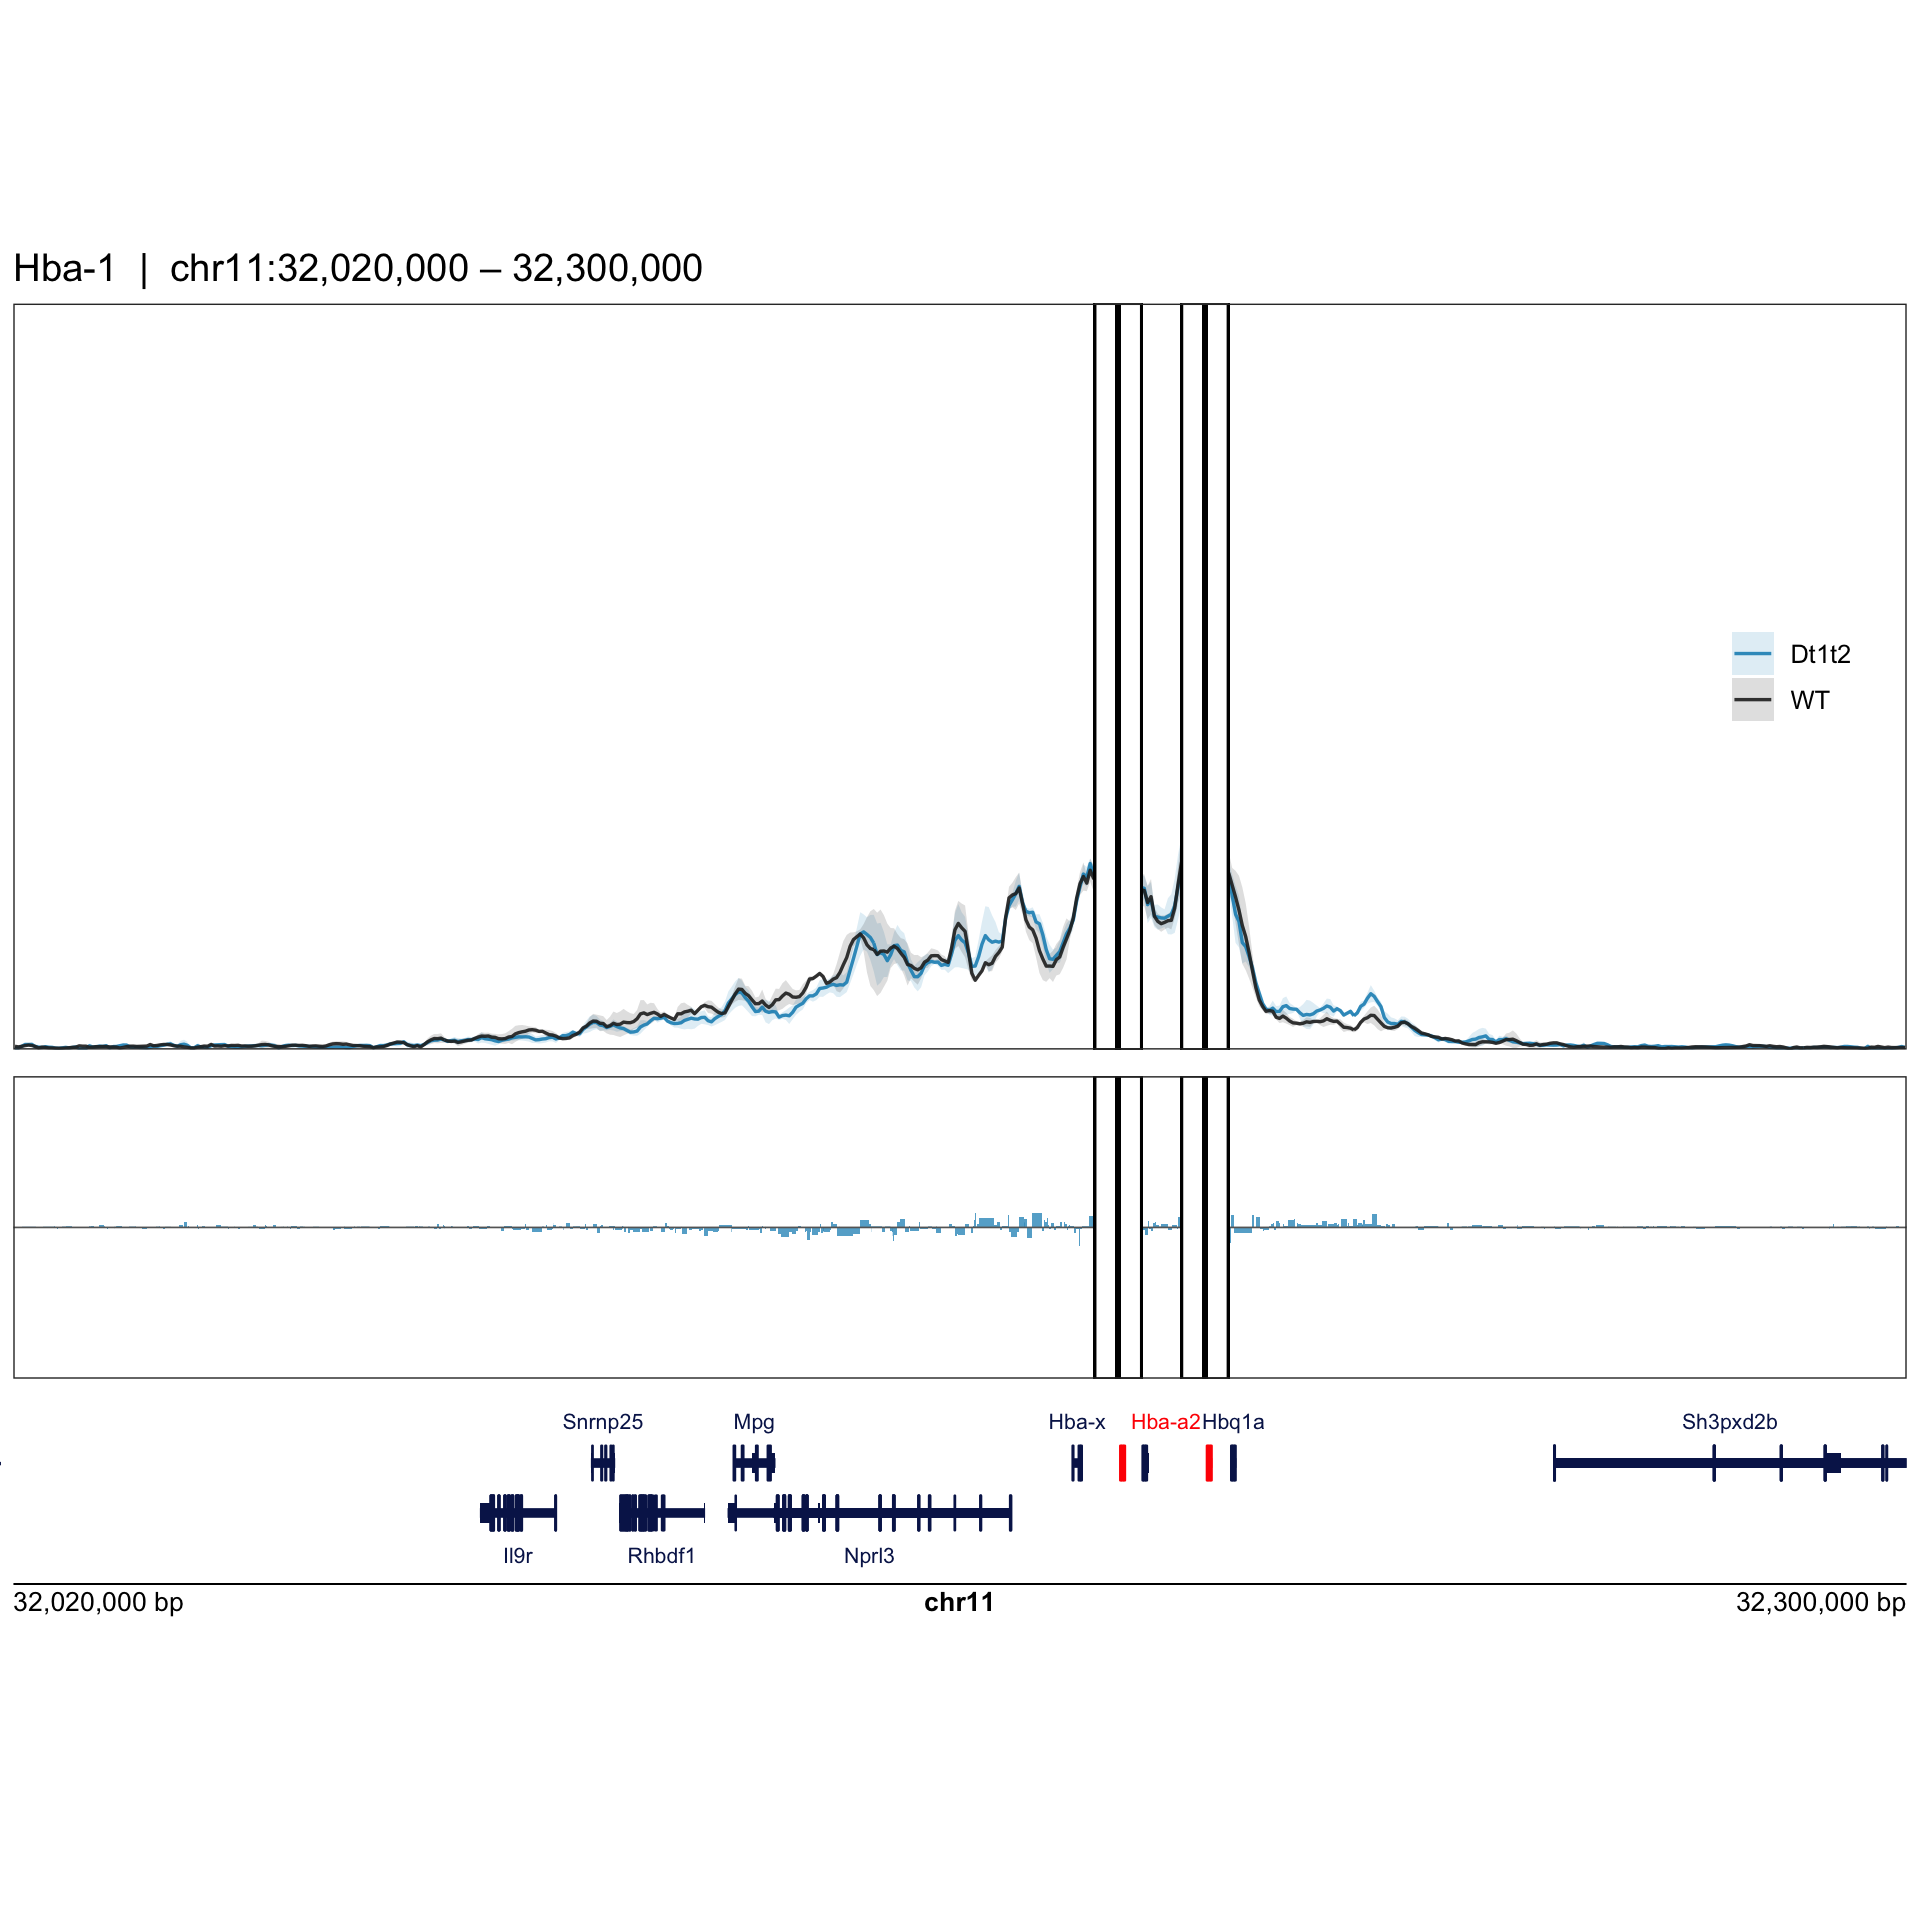
First we have to strip the axis text from all plots so the panel starts at a known, fixed x position — this is what lets plotgardener align underneath
p1 <- p1 +
  theme(axis.title.x = element_blank(),
        axis.text.x = element_blank(),
        axis.ticks.x = element_blank(),
        axis.title.y = element_blank(),
        axis.text.y = element_blank(),
        axis.ticks.y = element_blank(),
        plot.margin = margin(t = 5, r = 5, b = 5, l = 5, unit = "pt"))

delta_plot_list <- map(delta_plot_list, ~ .x +
  theme(axis.title.x = element_blank(),
        axis.text.x  = element_blank(),
        axis.ticks.x = element_blank(),
        axis.title.y = element_blank(),
        axis.text.y  = element_blank(),
        axis.ticks.y = element_blank(),
        plot.margin  = margin(t = 5, r = 5, b = 5, l = 5, unit = "pt")))

# Rebuild the combined plot with the stripped axes
all_plots <- c(list(p1), delta_plot_list)
rel_heights <- c(2.5, rep(1, length(delta_plot_list)))

final_plot <- plot_grid(plotlist = all_plots, ncol = 1,
                        align = "v", axis = "l", rel_heights = rel_heights)
Then adding in the gene annotations using plotgardener. Make sure to change the library called here and genome assembly to add the correct annotations.
library(plotgardener)

# Make sure to load/download the correct genome for your analysis
library(TxDb.Mmusculus.UCSC.mm9.knownGene)
library(org.Mm.eg.db)

gene_track_height <- 1
existing_height <- 4 + 2 * length(delta_plot_list)
total_height <- existing_height + gene_track_height

# Fixed margin in inches (5pt plot.margin ≈ 0.07in) — same for ggplot panel and gene track
track_x <- 0.07
track_width <- 10 - (2 * track_x)

{
  pageCreate(width = 10, height = total_height + 0.5, default.units = "inches",
             showGuides = FALSE)

  ## Genomic and dimension parameters
  params_c <- pgParams(chrom = chr_use, chromstart = plot_start, chromend = plot_end,
                       assembly = "mm9", x = track_x, width = track_width,
                       default.units = "inches")

  # --- Combined ggplot at the top ---
  plotGG(plot = final_plot, x = 0, y = 0,
         width = 10, height = existing_height,
         just = c("left", "top"))

  # --- Gene annotation track ---
  genes <- plotGenes(params = params_c, stroke = 0.05, fontsize = 8,
                     geneHighlights = data.frame("gene" = c("Hba-a1","Hba-a2"),"color" = c("red", "red")),
                     geneBackground = "#081D58", strandLabels = TRUE,
                     y = existing_height, height = gene_track_height)

  # --- Genomic coordinate ruler ---
  annoGenomeLabel(params = params_c, plot = genes, y = existing_height + gene_track_height)
}
DESeq2 statistical testing
DESeq2 uses raw (un-normalised) counts. Tests each fragment for significant contact differences between conditions.
| Column | Meaning |
|---|---|
baseMean |
Average normalised count across all samples |
log2FoldChange |
log₂(test / reference) — positive = more contacts in test |
padj |
Adjusted p-value — use this for significance |
direction |
up = gain, down = loss of contacts vs reference |
# Raw count matrix from df (no excl filter — we want all fragments for DESeq2)
count_mat <- df %>%
  mutate(fragment = paste0(chr, ":", start, "-", end)) %>%
  dplyr::select(fragment, sample, count) %>%
  dplyr::distinct() %>%
  pivot_wider(names_from = sample,
              values_from = count,
              values_fill = 0)

counts <- as.matrix(count_mat[, -1])
rownames(counts) <- count_mat$fragment
# Build the sample sheet for comparisons
coldata <- data.frame(row.names = sample_sheet$sample,
condition = factor(sample_sheet$condition, levels = cond_levels))
dds <- DESeqDataSetFromMatrix(countData = counts,
colData = coldata,
design = ~condition)# Run DESeq
dds <- DESeq(dds)# Extract the results, comparing reference to each condition
get_results <- function(test_cond, ref_cond) {
as.data.frame(results(dds, contrast = c("condition", test_cond, ref_cond))) %>%
rownames_to_column("fragment") %>%
separate(fragment, into = c("chr", "coords"), sep = ":", extra = "merge") %>%
separate(coords, into = c("start", "end"), sep = "-", convert = TRUE) %>%
mutate(comparison = paste0(test_cond, "_vs_", ref_cond),
direction = case_when(is.na(padj) ~ NA_character_,
log2FoldChange > 0 ~ "up",
log2FoldChange < 0 ~ "down",
TRUE ~ "unchanged"),
chr = as.character(chr),
start = as.integer(start),
end = as.integer(end)) %>%
dplyr::select(comparison, chr, start, end,
baseMean, log2FoldChange, lfcSE, stat, pvalue, padj, direction)
}non_ref <- setdiff(cond_levels, ref_condition)
all_results <- map(non_ref, ~ get_results(.x, ref_condition)) %>%
bind_rows()
sig_results <- all_results %>%
filter(!is.na(padj), padj < padj_thresh) %>%
arrange(padj)
print(paste0("Number of significant differences for ", plot_viewpoint ,": ", nrow(sig_results)))[1] "Number of significant differences for Hba-1: 0"# Write outputs to tables
all_out <- file.path(paste0(plot_viewpoint, "_", cond_string, "_DESeq2_all_results.tsv"))
write_tsv(all_results, all_out)
sig_out <- file.path(paste0(plot_viewpoint, "_", cond_string, "_DESeq2_significant.tsv"))
write_tsv(sig_results, sig_out)sessionInfo()R version 4.5.1 (2025-06-13)
Platform: x86_64-apple-darwin20
Running under: macOS Tahoe 26.5.1
Matrix products: default
BLAS: /Library/Frameworks/R.framework/Versions/4.5-x86_64/Resources/lib/libRblas.0.dylib
LAPACK: /Library/Frameworks/R.framework/Versions/4.5-x86_64/Resources/lib/libRlapack.dylib; LAPACK version 3.12.1
locale:
[1] C.UTF-8/C.UTF-8/C.UTF-8/C/C.UTF-8/C.UTF-8
time zone: Europe/London
tzcode source: internal
attached base packages:
[1] stats4 stats graphics grDevices utils datasets methods
[8] base
other attached packages:
[1] org.Mm.eg.db_3.21.0
[2] TxDb.Mmusculus.UCSC.mm9.knownGene_3.2.2
[3] GenomicFeatures_1.60.0
[4] AnnotationDbi_1.70.0
[5] plotgardener_1.14.0
[6] zoo_1.8-15
[7] cowplot_1.2.0
[8] DESeq2_1.48.2
[9] SummarizedExperiment_1.38.1
[10] Biobase_2.68.0
[11] MatrixGenerics_1.20.0
[12] matrixStats_1.5.0
[13] GenomicRanges_1.60.0
[14] GenomeInfoDb_1.44.3
[15] IRanges_2.42.0
[16] S4Vectors_0.46.0
[17] BiocGenerics_0.54.1
[18] generics_0.1.4
[19] lubridate_1.9.5
[20] forcats_1.0.1
[21] stringr_1.6.0
[22] dplyr_1.2.1
[23] purrr_1.2.2
[24] readr_2.2.0
[25] tidyr_1.3.2
[26] tibble_3.3.1
[27] ggplot2_4.0.3
[28] tidyverse_2.0.0
loaded via a namespace (and not attached):
[1] DBI_1.3.0 bitops_1.0-9 rlang_1.2.0
[4] magrittr_2.0.5 otel_0.2.0 RSQLite_3.52.0
[7] compiler_4.5.1 png_0.1-9 vctrs_0.7.3
[10] pkgconfig_2.0.3 crayon_1.5.3 fastmap_1.2.0
[13] XVector_0.48.0 labeling_0.4.3 utf8_1.2.6
[16] Rsamtools_2.24.1 rmarkdown_2.31 tzdb_0.5.0
[19] UCSC.utils_1.4.0 strawr_0.0.92 bit_4.6.0
[22] xfun_0.57 cachem_1.1.0 jsonlite_2.0.0
[25] blob_1.3.0 rhdf5filters_1.20.0 DelayedArray_0.34.1
[28] Rhdf5lib_1.30.0 BiocParallel_1.42.2 parallel_4.5.1
[31] R6_2.6.1 plyranges_1.28.0 stringi_1.8.7
[34] RColorBrewer_1.1-3 rtracklayer_1.68.0 Rcpp_1.1.1-1.1
[37] knitr_1.51 Matrix_1.7-5 timechange_0.4.0
[40] tidyselect_1.2.1 dichromat_2.0-0.1 abind_1.4-8
[43] yaml_2.3.12 codetools_0.2-20 curl_7.1.0
[46] lattice_0.22-9 KEGGREST_1.48.1 withr_3.0.2
[49] S7_0.2.2 evaluate_1.0.5 gridGraphics_0.5-1
[52] Biostrings_2.76.0 pillar_1.11.1 vroom_1.7.1
[55] RCurl_1.98-1.18 hms_1.1.4 scales_1.4.0
[58] glue_1.8.1 tools_4.5.1 BiocIO_1.18.0
[61] data.table_1.18.4 locfit_1.5-9.12 GenomicAlignments_1.44.0
[64] fs_2.1.0 XML_3.99-0.23 rhdf5_2.52.1
[67] grid_4.5.1 GenomeInfoDbData_1.2.14 restfulr_0.0.16
[70] cli_3.6.6 rappdirs_0.3.4 S4Arrays_1.8.1
[73] gtable_0.3.6 yulab.utils_0.2.4 digest_0.6.39
[76] SparseArray_1.8.1 ggplotify_0.1.3 rjson_0.2.23
[79] htmlwidgets_1.6.4 farver_2.1.2 memoise_2.0.1
[82] htmltools_0.5.9 lifecycle_1.0.5 httr_1.4.8
[85] bit64_4.8.0 This notebook also plots the genes under the plot and you have a bit more freedom to change the asthetics.